EO RISK
Earth Observation · Risk Intelligence · Building Toward Pilot
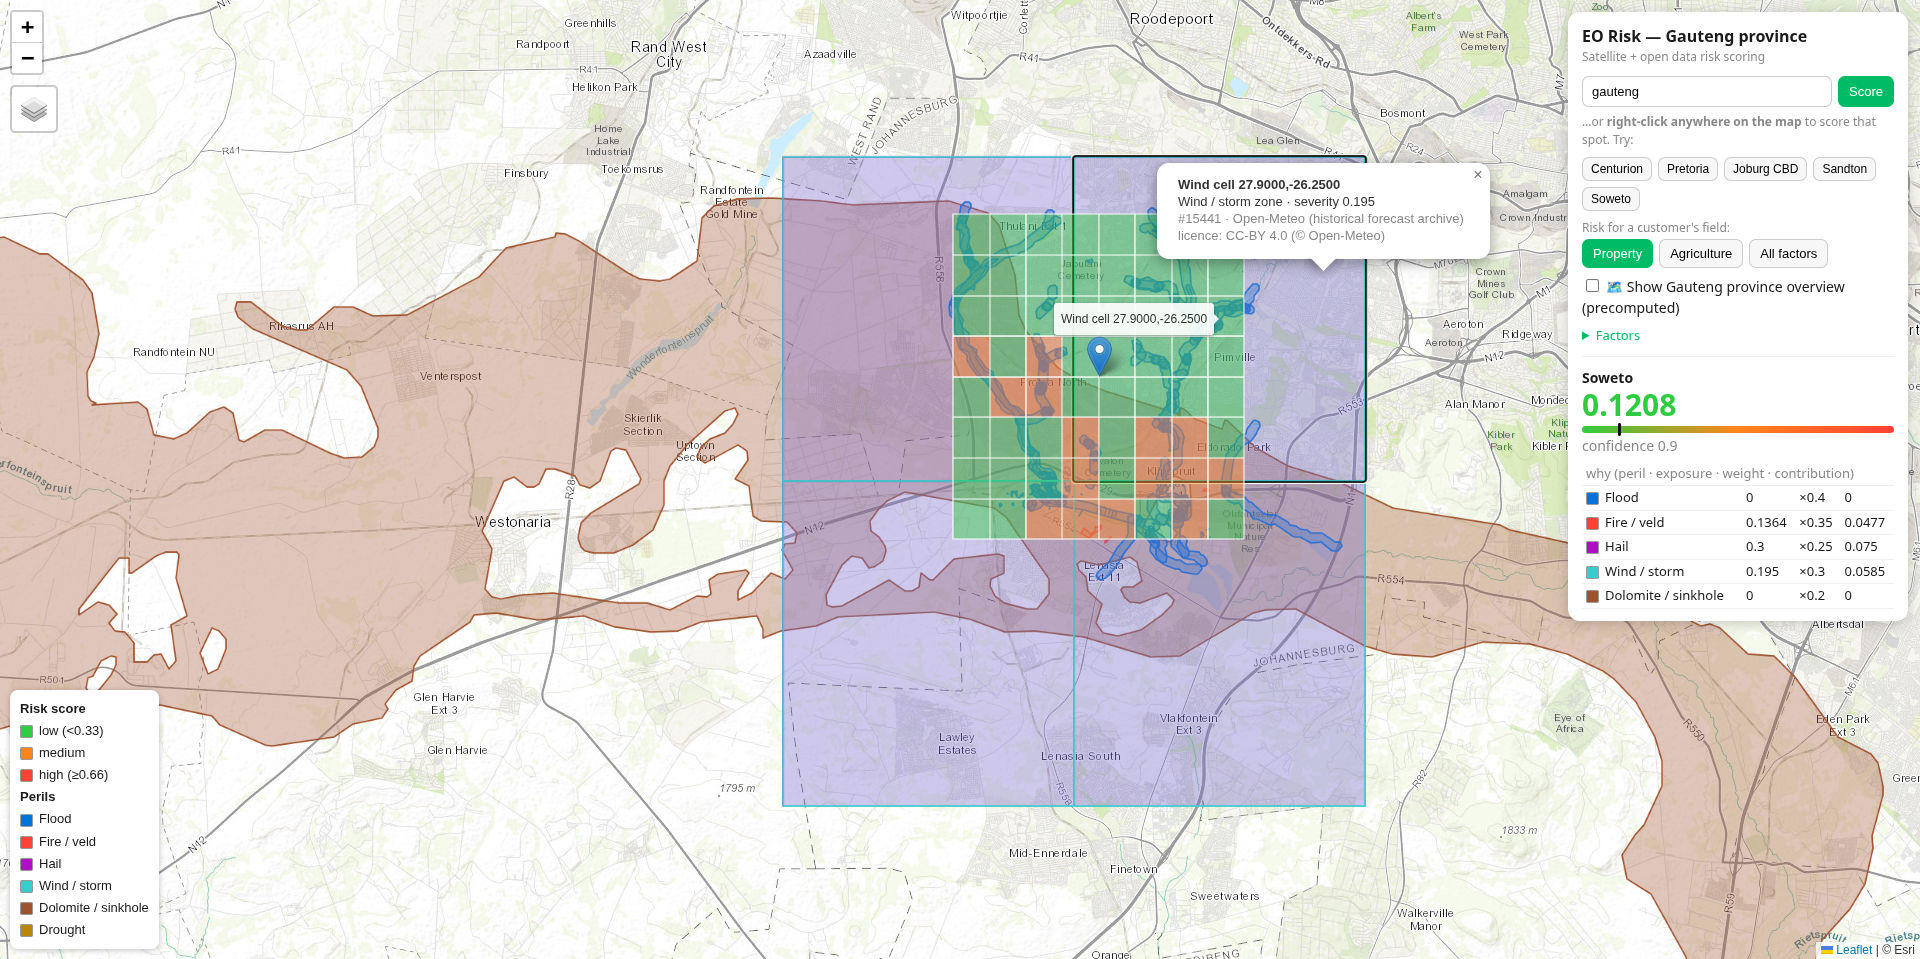
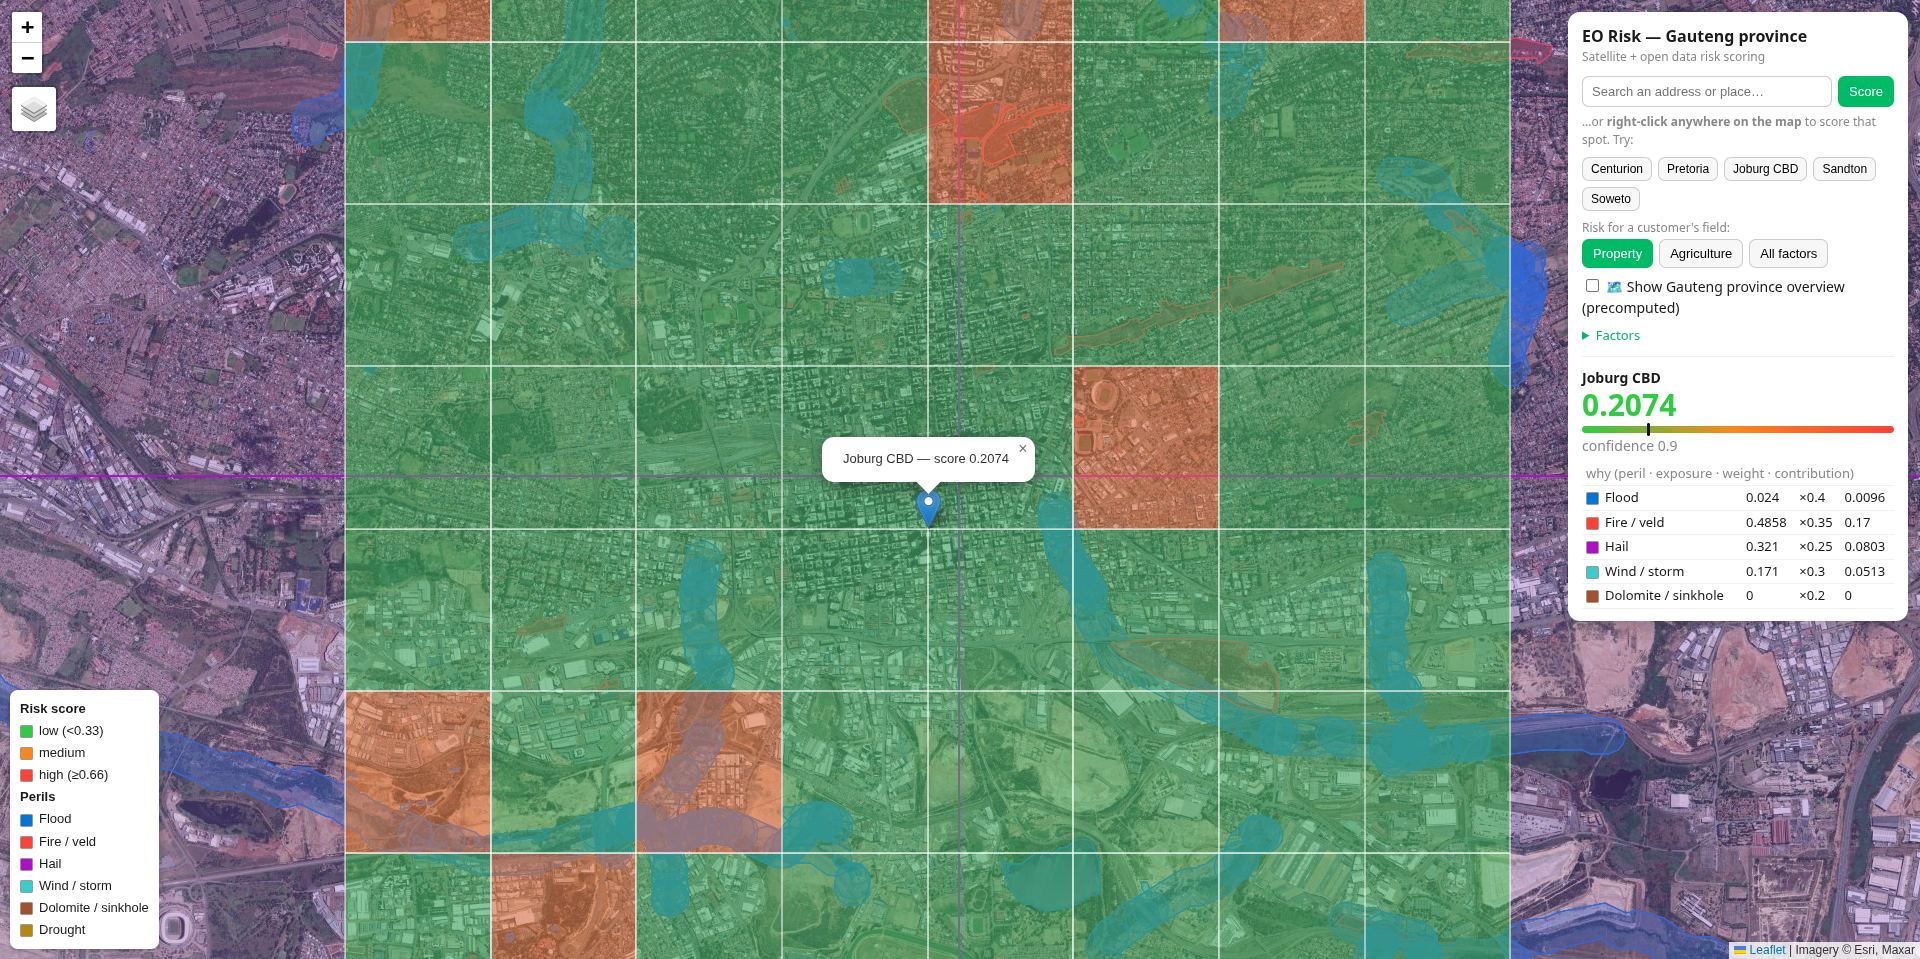
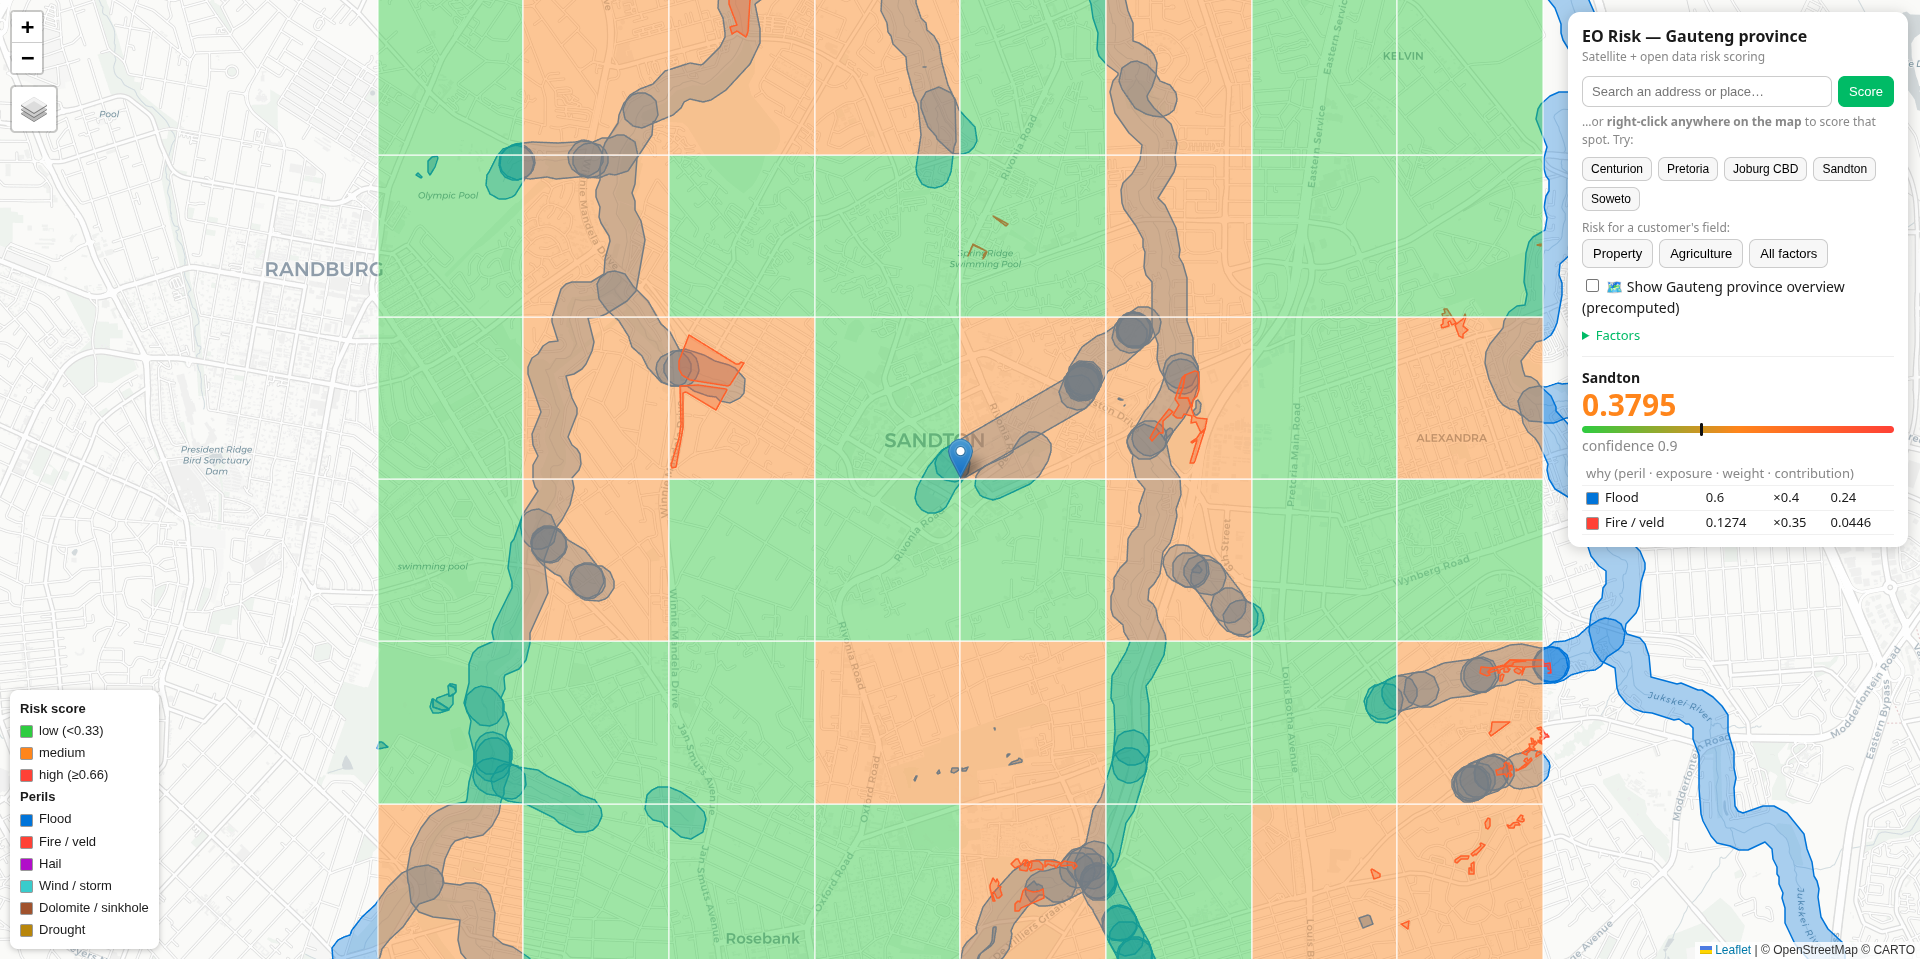
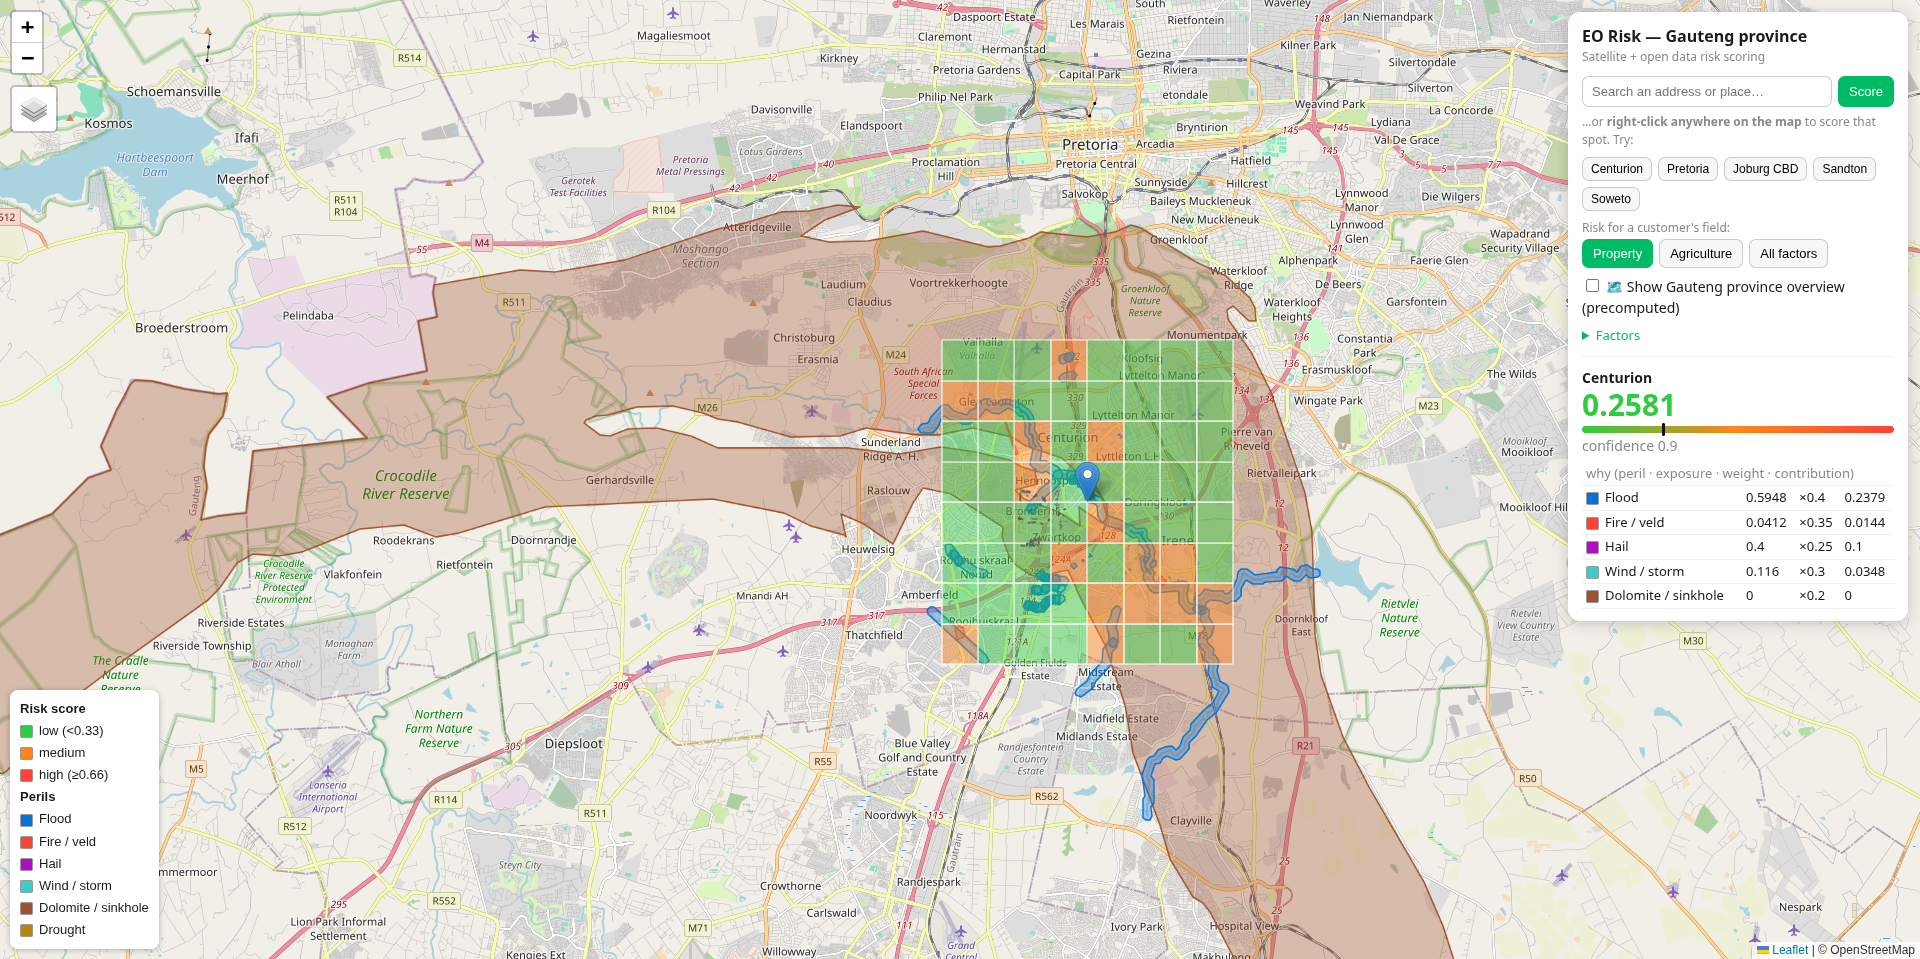
EO RISK PLATFORM.

A B2B API that turns satellite imagery into a risk decision an insurer can act on — without a site visit.

1
API Call
5
Perils Covered
Gauteng
Current Coverage
B2B
SaaS / Data API
The Problem

Why This
Exists

Insurers price and pay claims on properties they often can't see. Today that means manual inspections, stale data, or guesswork — slow, costly, and inconsistent.

01

Manual Inspections

Pricing and claims decisions that require someone on-site: slow, costly, and impossible to scale.

02

Stale Data

Insurers working from outdated surveys, desk estimates, or guesswork on property condition and exposure.

03

Inconsistent Pricing

Without a standardised assessment, risk is priced differently by every underwriter for the same property.

04

No Remote Assessment

No scalable way to evaluate a property's hazard exposure and condition without physical presence.

05

Slow Underwriting

Inspection bottlenecks stretch turnaround from hours into days or weeks — a cost and experience problem.

API Response

What You Get

Send an address or coordinate. Receive a structured risk assessment — embedded directly into your underwriting or claims workflow.

01

Property Attributes

Derived from satellite imagery and spatial datasets — no manual survey required.

  • Building footprint & area
  • Number of structures
  • Vegetation overhang
  • Pool & outbuilding presence
02

Hazard Exposure

Authoritative spatial overlays for the three primary property perils in South Africa.

  • Wildfire zone exposure
  • Flood zone exposure
  • Hail-risk zone
  • Location-resolved, not estimated
03

Composite Risk Score

A single score with a confidence value and the components behind it — explainable, never a black box.

  • Score + confidence value
  • Documented component weights
  • No hidden model decisions
  • Regulatory-friendly output
04

Evidence

The data behind the score — what was used, when it was captured, and where it came from.

  • Source dataset references
  • Date-stamped imagery links
  • Spatial layers used
  • Assessment timestamp
Process

How It Works

Four steps from request to decision. No geospatial tooling required on your side.

01

Submit

Send a POST /assess request with a property address or coordinate pair and your API key.

02

Assess

We resolve the property geometry, run hazard overlays, and extract attributes from satellite data.

03

Receive

A structured JSON response: score, confidence, components, attributes, hazard exposure, and evidence references.

04

Act

Embed the result directly into your underwriting, claims, or portfolio review workflow — no raw imagery, no GIS.

Satellite View
Property Risk
Insurers
Spatial Data
Agricultural Risk
Platform Preview

What You're
Working With

Real assessments. Real areas. Gauteng — scored from satellite and open spatial data.

EO Risk — Soweto scored at 0.1208 with wind cell tooltip showing Open-Meteo source
Soweto — Score 0.12

Wind/storm zone tooltip shows the underlying data source — Open-Meteo historical archive, CC-BY 4.0. Every factor is traceable to an authoritative dataset.

EO Risk — Joburg CBD scored at 0.2074 on satellite basemap with peril overlays
Joburg CBD — Score 0.21

Satellite basemap with risk overlays. Fire/veld dominates at 0.49 exposure. Five perils scored independently — flood, fire, hail, wind, and dolomite.

EO Risk area score — Sandton zoomed in with active flood, fire and hail overlays
Sandton — Score 0.38

Street-level view with live peril overlays. Flood corridors and medium-risk cells visible across the Sandton–Alexandra corridor.

EO Risk — Centurion scored at 0.2581 with dolomite and flood zones visible
Centurion — Score 0.26

Dolomite risk (brown) dominates the western areas. Flood exposure along the Rietvlei corridor. Five perils scored — confidence 0.9.

The Service

Two Ways
to Engage

Start with a low-commitment evaluation. Convert to an annual plan once it's embedded in your workflow.

Low Commitment

Per-Assessment

Pay per property scored. No long-term contract required. Ideal for evaluating the platform before integration.

  • Per-property pricing
  • API key issued immediately
  • No minimum volume
  • Ideal for pilots & due diligence
Embedded

Annual Subscription

Once integrated into your underwriting or claims workflow, a predictable annual plan. Product D (Water/Drought Risk) is a pure upsell on the same integration.

  • Predictable annual cost
  • Volume-based tier pricing
  • Product D as a no-integration upsell
  • Dedicated support & SLA
What's Included in Every Assessment
Talk to Us About a Pilot →
Platform

One Engine.
Two Products.

The same scoring engine pointed at different perils. Adding Product D requires no new integration from existing customers.

Available Now

Product A
Property & Asset Risk

Roof, footprint, vegetation, and hazard exposure → a property risk score. The primary product, actively building toward pilot readiness over one South African metro.

  • Wildfire, flood & hail exposure
  • Building footprint & attributes
  • Composite score + confidence
  • Explainable component breakdown
  • POST /assess — address or coordinates
Coming Next

Product D
Water & Drought Risk

The same scoring engine turned toward soil moisture, drought stress, and water-body levels. Sold to the same insurers and reinsurers as a zero-integration-cost upsell.

  • Soil moisture & drought stress
  • Water-body level monitoring
  • Irrigation & crop exposure
  • Same API contract as Product A
  • No new integration required

RISK
INTELLIGENCE.
DELIVERED.

Send an address. Receive a risk decision. No site visit, no geospatial tooling, no guesswork.

Request a Demo →